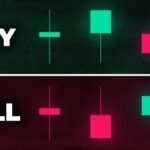
Candlestick patterns are a powerful tool used by traders to predict stock market trends. These patterns can help investors identify potential reversals or continuation of trends, allowing them to make more informed trading decisions.
Candlestick patterns are formed by the price movements of a stock over a period of time. Each candlestick represents a specific timeframe, such as a day, week, or month, and is made up of a body and wicks that show the high and low prices during that time period. By analyzing these patterns, traders can gain insights into the psychology of the market and make more accurate predictions about future price movements.
There are various types of candlestick patterns that traders can use to forecast stock market trends. Some of the most common patterns include:
– Doji: A doji is a candlestick pattern that indicates indecision in the market. It occurs when the opening and closing prices are nearly the same, resulting in a small body with long wicks. A doji often signals a potential reversal in the trend, as buyers and sellers are evenly matched and unable to push the price in either direction.
– Hammer: A hammer is a bullish reversal pattern that forms at the bottom of a downtrend. It has a small body with a long lower wick, indicating that buyers have stepped in to support the stock and push prices higher. A hammer suggests that the trend may be about to change direction and move upwards.
– Shooting Star: A shooting star is a bearish reversal pattern that forms at the top of an uptrend. It has a small body with a long upper wick, indicating that sellers have entered the market and are pushing prices lower. A shooting star suggests that the trend may be about to change direction and move downwards.
By studying these and other candlestick patterns, traders can gain a better understanding of market dynamics and identify potential entry and exit points for their trades. By combining candlestick patterns with other technical indicators and fundamental analysis, traders can improve their overall trading strategy and increase their chances of success in the stock market.
In conclusion, candlestick patterns are a valuable tool for predicting stock market trends. By analyzing these patterns and understanding the psychology behind them, traders can make more informed decisions and improve their trading outcomes. Whether you are a novice investor or an experienced trader, incorporating candlestick patterns into your analysis can help you navigate the complex world of the stock market with greater confidence and success.


