Understanding Bullish Candlestick Charts: A Guide for Investors
For investors looking to make informed decisions in the stock market, understanding the patterns and formations of candlestick charts is crucial. Bullish candlestick charts, in particular, can provide valuable insights into market trends and potential price movements. In this guide, we will delve into the basics of bullish candlestick charts and how investors can use them to their advantage.
What are bullish candlestick charts?
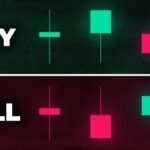
Candlestick charts are a popular type of financial chart used to represent price movements in the stock market. Each candlestick typically represents one day of trading and consists of a body and wicks, or shadows, on either end. A bullish candlestick, also known as an uptrend candlestick, is characterized by a closing price that is higher than the opening price, indicating that the market sentiment is positive.
Key components of bullish candlestick charts
There are several key components of a bullish candlestick chart that investors should be familiar with:
1. Body: The body of a bullish candlestick represents the difference between the opening and closing prices. A long body indicates a significant price movement, while a short body suggests a more modest price change.
2. Upper wick: The upper wick, or shadow, represents the highest price reached during the trading period. A long upper wick indicates that the price reached a high before falling back down.
3. Lower wick: The lower wick, or shadow, represents the lowest price reached during the trading period. A long lower wick indicates that the price reached a low before rebounding.
Interpreting bullish candlestick patterns
Bullish candlestick patterns can provide valuable insights into market sentiment and potential price movements. Some common bullish candlestick patterns include:
1. Hammer: A hammer candlestick has a small body with a long lower wick, resembling a hammer. This pattern often signals a potential reversal from a downtrend to an uptrend.
2. Bullish engulfing: A bullish engulfing pattern occurs when a large bullish candlestick engulfs the previous bearish candlestick, indicating a shift in market sentiment from negative to positive.
3. Morning star: The morning star pattern consists of three candlesticks – a long bearish candlestick, a small bullish or bearish candlestick, and a long bullish candlestick. This pattern suggests a potential reversal from a downtrend to an uptrend.
Using bullish candlestick charts for investment decisions
Investors can use bullish candlestick charts to identify potential buying opportunities and trend reversals. By recognizing bullish patterns and understanding market sentiment, investors can make more informed decisions about when to enter or exit the market.
It is important to note, however, that candlestick patterns should not be used in isolation and should be used in conjunction with other technical indicators and analysis tools to confirm potential price movements.
In conclusion, understanding bullish candlestick charts is essential for investors seeking to make informed decisions in the stock market. By familiarizing themselves with the key components and patterns of bullish candlestick charts, investors can gain valuable insights into market trends and potential price movements. When used in conjunction with other technical analysis tools, bullish candlestick charts can be a powerful tool for making investment decisions.


