Candlestick patterns are a popular tool used by traders to help predict future price movements in financial markets. While they may seem intimidating at first, understanding and incorporating candlestick patterns into your trading strategy can greatly enhance your success as a trader. In this article, we will demystify candlestick patterns and provide tips on how to effectively incorporate them into your trading strategy.
What are Candlestick Patterns?
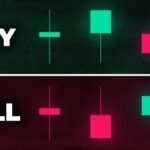
Candlestick patterns are visual representations of price movements in the financial markets. Each candlestick represents a specific time frame, such as a day, week, or month, and shows the open, high, low, and close prices during that time period. The body of the candlestick represents the opening and closing prices, while the wicks or shadows represent the high and low prices.
There are many different types of candlestick patterns, each with its own unique characteristics and significance. Some common patterns include the Doji, Hammer, Shooting Star, Engulfing, and Hanging Man, among others. These patterns can provide valuable insights into market sentiment and potential price reversals.
Incorporating Candlestick Patterns Into Your Trading Strategy
When incorporating candlestick patterns into your trading strategy, it is important to first familiarize yourself with the various patterns and their meanings. Learning to recognize these patterns on price charts can help you make more informed trading decisions.
Here are some tips for effectively incorporating candlestick patterns into your trading strategy:
1. Use multiple time frames: It can be helpful to analyze candlestick patterns on multiple time frames, such as daily, weekly, and monthly charts. This can provide a more comprehensive view of market trends and potential reversals.
2. Combine with other technical indicators: Candlestick patterns should not be used in isolation. It is important to combine them with other technical indicators, such as moving averages, support and resistance levels, and trend lines, to confirm your trading signals.
3. Look for confluence: When analyzing candlestick patterns, look for confluence with other technical factors. For example, if a Hammer pattern forms near a key support level, this can increase the likelihood of a reversal.
4. Practice proper risk management: As with any trading strategy, it is important to practice proper risk management when incorporating candlestick patterns. This includes setting stop-loss orders and limiting the size of your positions to minimize potential losses.
5. Continuously educate yourself: The financial markets are constantly evolving, so it is important to continuously educate yourself on new candlestick patterns and trading strategies. Stay up to date with market news and developments to improve your trading skills.
In conclusion, candlestick patterns can be a valuable tool for traders looking to enhance their trading strategy. By understanding the different patterns and incorporating them into your analysis, you can improve your ability to predict market movements and make more profitable trades. Remember to practice proper risk management and continuously educate yourself to stay ahead in the fast-paced world of trading.


