Day trading can be a fast-paced and exciting way to make money in the stock market. However, it can also be a challenging endeavor that requires a good understanding of market trends and patterns. One powerful tool that day traders use to analyze market movements is candlestick patterns. These patterns can provide valuable insights into the market’s direction and help traders make informed decisions about when to buy or sell.
Candlestick patterns are a form of technical analysis that originated in Japan in the 18th century. They are used to identify potential reversals or continuations in price movements based on the shape and position of the candles on a price chart. There are many different types of candlestick patterns, each with its own unique characteristics and implications for market trends.
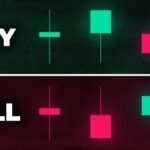
One popular candlestick pattern that day traders often use is the “doji.” A doji candle has a small body with long wicks on both ends, indicating that the market opened and closed at approximately the same price. This pattern is often interpreted as a sign of indecision in the market and can signal a potential reversal in price direction.
Another common candlestick pattern is the “hammer.” A hammer candle has a small body at the top of a long wick, resembling a hammer. This pattern typically appears at the bottom of a downtrend and signals a potential reversal in price direction as buyers step in to push the price higher.
By learning to recognize and interpret different candlestick patterns, day traders can gain valuable insights into market sentiment and make more informed trading decisions. Here are a few tips for boosting your day trading game with candlestick patterns:
1. Study and practice: Take the time to learn about different candlestick patterns and how they can be used to analyze market trends. Practice identifying patterns on price charts and familiarize yourself with their implications for price movements.
2. Use multiple timeframes: Look for confirmation of candlestick patterns across multiple timeframes to increase the reliability of your analysis. For example, if you see a hammer pattern on a 5-minute chart, check the 15-minute or 1-hour chart to see if the pattern is confirmed on higher timeframes.
3. Combine with other indicators: Candlestick patterns are most effective when used in conjunction with other technical indicators, such as moving averages or volume analysis. By combining different tools, you can develop a more comprehensive trading strategy that takes into account multiple factors influencing market trends.
4. Practice risk management: Remember that no trading strategy is foolproof, and there will always be risks involved in day trading. Use stop-loss orders to limit your losses and avoid overleveraging your trades. By managing your risk effectively, you can protect your capital and improve your chances of success in the market.
In conclusion, candlestick patterns are a valuable tool for day traders looking to boost their trading game and make more informed decisions in the market. By studying and practicing different patterns, using multiple timeframes, combining with other indicators, and practicing proper risk management, you can develop a strong foundation for successful day trading. Remember that consistency and discipline are key to becoming a successful day trader, so stay patient and focused on your goals as you navigate the ups and downs of the market.


