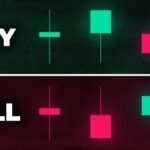
Candlestick patterns are a popular tool used by traders to help predict future price movements in the financial markets. By understanding and correctly interpreting these patterns, beginners can gain valuable insights into market trends and make informed trading decisions.
What are Candlestick Patterns?
Candlestick patterns are visual representations of price movements in the financial markets. Each candlestick on a chart represents the price action of a specific time period, whether it be one minute, one hour, one day, or longer. The color of the candlestick can indicate whether the price increased or decreased during that time period.
There are a wide variety of candlestick patterns, with each one having its own unique characteristics and implications. Some patterns are relatively simple, with just one or two candlesticks, while others are more complex and require multiple candlesticks to form.
How to Use Candlestick Patterns Charts
To effectively use candlestick patterns charts, beginners should focus on identifying and understanding the most common and reliable patterns. Some of the key patterns to look out for include:
1. Doji: A doji is a candlestick pattern with nearly equal open and closing prices, indicating indecision in the market. Traders often interpret a doji as a signal of a potential trend reversal.
2. Hammer: A hammer is a bullish reversal pattern that forms at the bottom of a downtrend. It has a small body at the top of the candlestick and a long lower shadow, indicating that buyers are starting to enter the market.
3. Engulfing pattern: An engulfing pattern consists of two candlesticks, with the second candle completely covering or “engulfing” the first. A bullish engulfing pattern forms when a bullish candle follows a bearish one, indicating a potential trend reversal.
4. Morning star: A morning star is a bullish reversal pattern that consists of three candlesticks. The first is a long bearish candle, followed by a small-bodied candle or doji, and then a bullish candle that closes above the first candle. This pattern suggests that the downtrend is weakening and a reversal is likely.
It’s important for beginners to remember that no single candlestick pattern is foolproof, and it’s essential to use them in conjunction with other technical analysis tools and indicators. Furthermore, it’s crucial to consider the context in which the pattern appears, such as market trends, volume, and support and resistance levels.
In conclusion, candlestick patterns can be a valuable tool for beginners looking to improve their trading skills and gain a better understanding of market trends. By learning to interpret these patterns correctly and incorporating them into their trading strategies, beginners can make more informed decisions and increase their chances of success in the financial markets.


