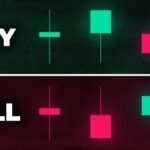
Introduction to Bullish Candlestick Patterns
Bullish candlestick patterns are popular chart patterns used in technical analysis to predict future price movements in the stock market. These patterns indicate a potential uptrend or bullish momentum in a stock’s price.
Types of Bullish Candlestick Patterns
1. Hammer: A hammer candlestick has a small body with a long lower wick, indicating a potential reversal from a downtrend to an uptrend.
2. Engulfing: An engulfing candlestick pattern occurs when a larger bullish candle “engulfs” the previous bearish candle, signaling a shift in market sentiment.
3. Morning Star: The morning star pattern consists of three candles – a large bearish candle, a small-bodied candle, and a large bullish candle – indicating a bullish reversal.
Significance of Bullish Candlestick Patterns
Bullish candlestick patterns can provide traders with valuable insights into market trends and potential price movements. By recognizing these patterns, traders can make informed decisions about buying or selling stocks at the right time.
Using Bullish Candlestick Patterns in Trading
Traders often combine bullish candlestick patterns with other technical indicators to confirm their signals. It is essential to consider the overall market context and volume levels when interpreting these patterns.
Hashtags: #bullishcandlestick #stocktrading #technicalanalysis #chartpatterns #tradingstrategies


