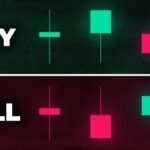
Introduction to Bullish Candlestick Patterns
Bullish candlestick patterns are formations on a price chart that signal a potential upward movement in an asset’s price. These patterns are used in technical analysis to help traders and investors identify potential buying opportunities and bullish trends in the market.
Types of Bullish Candlestick Patterns
1. Hammer: A single candlestick pattern that indicates a potential reversal from a downtrend to an uptrend. It has a small body and a long lower wick.
2. Engulfing: A two-candle pattern where the second candle completely engulfs the body of the first candle. It signals a strong shift in momentum from bears to bulls.
3. Morning Star: A three-candle pattern that consists of a large bearish candle, a small bullish or bearish candle, and a large bullish candle. It predicts a bullish reversal.
4. Bullish Harami: A two-candle pattern where the first candle is bearish and the second candle is small and bullish, typically within the range of the first candle.
How to Use Bullish Candlestick Patterns in Stock Market Analysis
Traders and investors can use bullish candlestick patterns in conjunction with other technical indicators to confirm potential buying opportunities. It is important to consider the overall market conditions and not rely solely on candlestick patterns for trading decisions.
Conclusion
Understanding bullish candlestick patterns is essential for traders and investors looking to identify potential bullish trends in the stock market. By incorporating these patterns into their technical analysis, individuals can improve their decision-making process and increase their chances of achieving successful trades.
Hashtags: #BullishCandlestick #StockMarketAnalysis #TechnicalAnalysis #BullishPatterns #TradingStrategies


