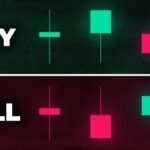
This is an introduction to candlesticks and candlestick patterns for beginners who want to learn the basics of trading, all the trading materials provided in this class will be applicable for trading any type of market, whether you just learning how to trade forex, crypto, and stocks
The exchange I’m using is Bybit, get up to $4000 when signing up. Plus a share of $3000, reduced trading fees to the first 1000 who sign up using this link
0:00 Class introduction
Whenever someone wants to start learning how to trade, candlesticks are always the first recommendation. Learning the basics of candlesticks provides beginners traders with a general overview of how trading works.
Very often as a beginner trader you will learn candlesticks and candlestick patterns and these candlestick patterns that supposedly give you a direction on what to expect next on the market
Unfortunately, I find this information to be misleading because all the candlestick patterns out there will give you trading data of previous events and do not guarantee the events of the future, not to mention that it’s very difficult to find these candlesticks patterns on a daily basis.
I’m of the view that as a beginner trader the only thing you have to know when it comes to candlesticks is the basics of candlesticks, how candlesticks are formed and how to read candlesticks.
02:59 what is a candlestick
A candlestick is a graphical line representation of the price action of a traded asset. A candlestick allows chartists and traders to visually see a representation of price action in a given time frame, this price action basically represents the performance of a given asset. The candlestick will show the open, high, low, and closing prices within a selected time frame.
Candlestick can indicate that the traded assets were bullish or bearish, basically, a candlestick represents data of the traded assets.
03:54 understanding the basics of candlesticks
The basics of candlesticks are the only thing you have to know as mentioned before, going in-depth on this subject can actually confuse beginners as they try to memorize all the candlestick patterns out there. In this chapter, we will however look at some candlestick patterns so that you can get an idea of what we talking about
11:56 piercing line
A bullish signal occurs in the context of a downtrend when, after a long bearish candle, a bullish candle opens at a new low and then closes at a level at least halfway up the body of the previous bar; this signal is reliable as a two-bar indicator of a trend reversal in proportion to the height of the second bullish bar. As the strength of the reversal signal is related to the size of the second candle, this pattern is similar to the Tweezer pattern, which is discussed later in this guide.
20:40 three white solders
The three white soldiers pattern consists of three consecutive green candlesticks that all open within the previous candle’s body, and close at a level exceeding the previous candle’s high.
Ideally, these candlesticks shouldn’t have long lower wicks, indicating that continuous buying pressure is driving the price up. The size of the candles and the length of the wicks can be used to judge the chances of continuation or a possible retracement.
22:19 Three black crows
The three black crows are made of three consecutive red candlesticks that open within the previous candle’s body and close at a level below the previous candle’s low.
The bearish equivalent of three white soldiers. Ideally, these candlesticks shouldn’t have long higher wicks, indicating continuous selling pressure driving the price down. The size of the candles and the length of the wicks can be used to judge the chances of continuation.
24:17 hammer
Hammer candlestick pattern
A bullish candlestick hammer is formed when the closing price is above the opening price, suggesting that buyers had control over the market before the end of that trading period, a hammer can be a red cane or green candle
32:08 knowing what is going to happen next on the market, to have an edge on the market and stay constantly profitable on your trades you must always know the overall Sentiment of the market you are trading. In this part of the video, I reflect on what I mentioned at the time of the recording
34:35 Identifying a hammer on ETH chart
36:27 Doji
Doji forms when the open and the close are the same (or very close to each other). The price can move above and below the open but eventually closes at or near the open. As such, a Doji may indicate an indecision point between buying and selling forces. Still, the interpretation of a Doji is highly dependent on context.
Depending on where the line of the open/close falls, a Doji can be described as:
40:28 closing
If you enjoyed this class on understanding the basics of candlesticks and candlestick patterns, please consider liking the video and subscribe
source


