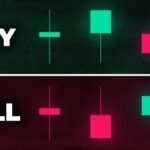
Candlestick patterns chart is a popular tool used by traders to analyze and predict market trends. It is a visual representation of price movements over a specific period of time, and mastering the art of reading these patterns can greatly enhance a trader’s ability to make informed decisions.
The first step in mastering candlestick patterns chart is understanding the different types of candlesticks and what they represent. There are several basic candlestick patterns, such as doji, hammer, shooting star, and engulfing pattern, each of which conveys important information about market sentiment and potential price movements.
For example, a doji candlestick pattern represents indecision in the market and is often a signal of a potential trend reversal. On the other hand, a hammer candlestick pattern indicates a potential bullish reversal, while a shooting star suggests a potential bearish reversal. Understanding the significance of these patterns and how they relate to market conditions is crucial for successful trading.
In addition to recognizing individual candlestick patterns, traders must also be able to interpret the meaning of multiple candlestick formations. For instance, a series of consecutive bullish candlesticks can indicate a strong uptrend, while a series of consecutive bearish candlesticks may signal a downtrend. By analyzing the length and direction of these patterns, traders can gain insight into market momentum and make more accurate predictions.
Another key aspect of mastering the art of reading candlestick patterns chart is understanding the significance of support and resistance levels. Support levels are price points at which a security tends to find buying interest and prevent further downward movement, while resistance levels are price points at which a security tends to encounter selling pressure and prevent further upward movement. By identifying these levels on a candlestick chart, traders can anticipate potential price reversals and adjust their trading strategies accordingly.
Finally, mastering candlestick patterns chart also involves considering the broader market context. Factors such as volume, market trends, and fundamental analysis can all influence the interpretation of candlestick patterns. By incorporating these additional factors into their analysis, traders can develop a more comprehensive understanding of market conditions and improve their ability to make profitable trades.
In conclusion, mastering the art of reading candlestick patterns chart requires a combination of knowledge, experience, and practice. By familiarizing oneself with the different types of candlestick patterns, interpreting multiple candlestick formations, identifying support and resistance levels, and considering broader market factors, traders can develop a more nuanced understanding of market dynamics and improve their trading performance. With dedication and perseverance, traders can become proficient in using candlestick patterns to inform their trading decisions and achieve greater success in the market.


